Campaign Performance Metrics: A 2026 Guide for Marketers
A practical framework for connecting business impact, operational health and creative performance.

Campaign performance metrics tell you whether your marketing is creating meaningful business movement, not simply generating activity.
The challenge is rarely a lack of data. Most marketing teams have more data than they can use. The real challenge is knowing which signals matter, how they relate to one another, and what action to take next.
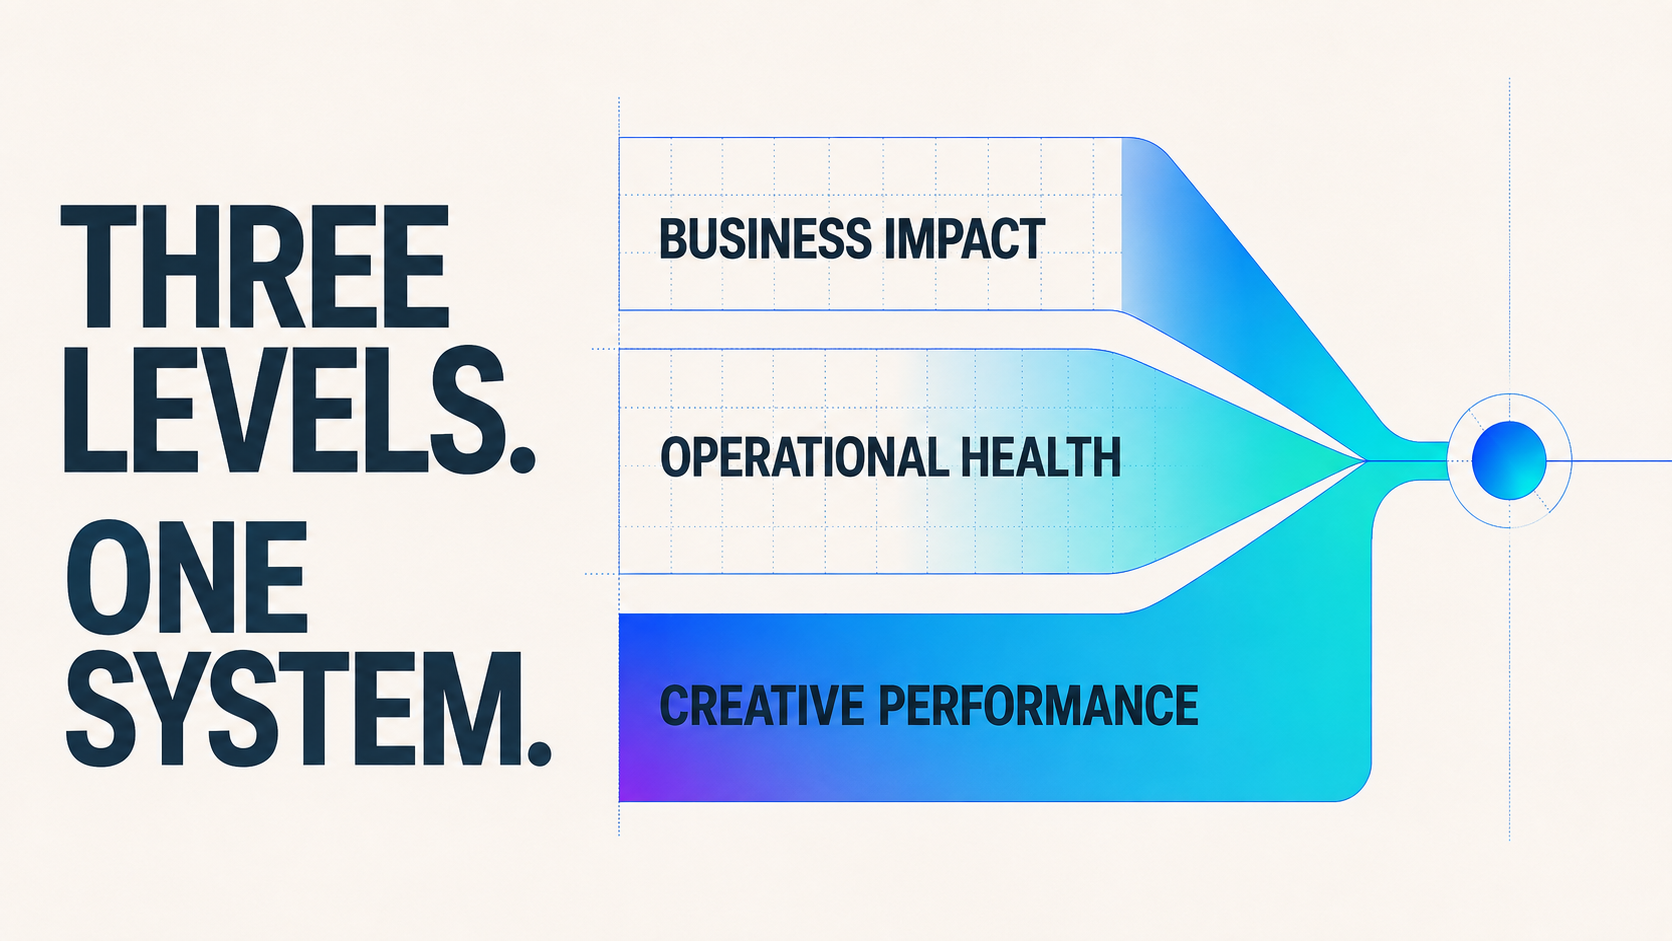
A useful measurement framework connects three levels of performance:
- Business impact: Is marketing contributing to revenue, growth, and customer value?
- Operational health: Is the campaign converting efficiently across the funnel?
- Creative performance: Are the message, idea, and experience earning attention and motivating action?
When these levels are viewed together, metrics become more than a report card. They become a system for improving the work.
The most useful metric is not the one that looks best in a presentation. It is the one that helps your team make a better decision.
What are campaign performance metrics?
Campaign performance metrics are quantitative indicators used to evaluate how effectively a campaign is reaching its audience, influencing behavior, and contributing to business goals.
They can show whether people saw the work, engaged with it, took the next step, became qualified leads, or ultimately generated revenue. No single metric can explain all of those outcomes.
That is why campaign measurement should begin with the objective. A brand-awareness campaign, a demand-generation program, and a customer-retention campaign should not be judged by the same primary KPI.
Before launch, define:
- The business outcome the campaign should support
- The audience behavior that would indicate progress
- The creative signals that can reveal problems early
- The timeframe in which meaningful change can reasonably occur
This creates a direct line from strategy to execution to measurement.
The three levels of campaign measurement
1. Business impact metrics
Business impact metrics connect marketing investment to commercial outcomes. They matter most in executive conversations and longer-term planning.
Common examples include:
- Return on investment
- Return on ad spend
- Customer acquisition cost
- Customer lifetime value
- Marketing-sourced or marketing-influenced revenue
- Pipeline contribution
These metrics help answer the question leadership ultimately asks: Was the investment worthwhile?
They are essential, but they often move too slowly to diagnose a campaign in real time. By the time revenue or customer acquisition cost confirms that something is wrong, the underlying problem may have been visible for weeks in the creative or funnel data.
2. Operational health metrics
Operational metrics show how efficiently people are moving through the campaign experience.
Common examples include:
- Conversion rate
- Cost per lead
- Cost per acquisition
- Marketing-qualified leads
- Sales-qualified leads
- Landing-page completion rate
- Lead-to-opportunity conversion
These metrics help teams identify friction in targeting, media, landing pages, offers, and follow-up. They are especially valuable for comparing channels and making mid-campaign budget decisions.
3. Creative performance metrics
Creative performance metrics reveal whether the work is earning attention and communicating effectively.
Common examples include:
- Click-through rate
- Engagement rate
- Video completion rate
- View-through rate
- Time on page
- Scroll depth
- Message or creative variant performance
- Brand lift and consideration lift
These signals do not prove revenue impact on their own. But they can reveal whether the idea is resonating long before bottom-funnel results arrive.
For enterprise brands with long or complex buying cycles, that early diagnostic value is critical.
Essential campaign metrics and what they actually tell you
Return on investment
ROI measures profit relative to the total campaign investment. It helps determine whether the overall investment created financial value.
Return on ad spend
ROAS measures revenue generated per dollar of advertising spend. It provides a focused view of paid-media efficiency, but it does not account for every cost associated with the campaign.
Customer acquisition cost
CAC measures the total cost required to acquire a new customer. It helps teams evaluate whether acquisition economics are sustainable.
Customer lifetime value
CLV estimates the value of a customer relationship over time. It helps determine how much the business can responsibly invest in acquisition and retention.
Conversion rate
Conversion rate measures the percentage of users who complete a defined action. It can help reveal whether the campaign experience and offer are successfully moving people forward.
Cost per lead
CPL measures the cost required to generate a lead. It helps teams understand whether lead generation is becoming more or less efficient.
Click-through rate
CTR measures the percentage of impressions that generate clicks. It can indicate whether the message and creative are earning enough interest to prompt action.
Engagement rate
Engagement rate measures the percentage of the audience interacting with the content. It can show whether the work feels relevant enough to invite participation.
Video completion rate
Video completion rate measures the percentage of viewers who reach a defined point or complete the video. It can reveal whether the story, pace, and value exchange sustain attention.
Brand lift
Brand lift measures changes in awareness, perception, consideration, or intent. It helps determine whether exposure to the campaign changed how people think or feel about the brand.
The right primary metric depends on the campaign goal:
- Awareness: Reach, frequency, video completion, view-through rate, and brand lift
- Consideration: CTR, engaged sessions, time on page, content downloads, and consideration lift
- Conversion: Conversion rate, CPL, CPA, pipeline contribution, and ROAS
- Retention or expansion: Product engagement, renewal rate, upsell revenue, and CLV
How to read campaign metrics together
Individual metrics describe symptoms. Combinations of metrics are much better at revealing causes.

Strong CTR, weak conversion rate
The creative is generating interest, but the post-click experience is not fulfilling the promise. The issue may be message mismatch, landing-page friction, or an offer that feels less compelling once people arrive.
What to examine: Headline continuity, page speed, offer clarity, form length, and audience intent.
High engagement, low qualified-lead volume
The content may be interesting without being commercially relevant. Broad thought leadership can earn interaction while attracting people who are unlikely to become customers.
What to examine: Audience targeting, topic-to-offer alignment, call to action, and qualification criteria.
Healthy lead volume, poor downstream quality
The campaign is converting, but possibly for the wrong reasons or with the wrong audience.
What to examine: Targeting, lead source, message specificity, qualification thresholds, and the expectations created by the creative.
Strong completion rate, weak recall or lift
People watched the content, but the central message may not have been distinctive or memorable enough.
What to examine: Opening idea, brand attribution, message hierarchy, emotional tension, and the role of the brand in the story.
Rising media costs, stable creative performance
The work may still be effective, while auction pressure, audience saturation, or channel conditions are reducing efficiency.
What to examine: Frequency, audience overlap, placement mix, competitive activity, and channel diversification.
The lesson is simple: Do not optimize a metric until you understand what is driving it.
Why creative measurement matters
Marketing performance is often discussed as if the media plan, audience, offer, and creative can be evaluated independently. In practice, they shape one another.
A weak click-through rate may reflect poor targeting. It may also mean the message lacks relevance, the idea is too familiar, or the value proposition is buried. A strong conversion rate may signal an effective landing page, but it may also begin with creative that sets the right expectation before the click.
Creative measurement should answer more than “Which ad won?” It should help explain:
- Which message created the strongest response
- Which audience found that message most relevant
- Which visual or narrative device sustained attention
- Which promise carried successfully into the landing experience
- Which elements should be retained, refined, or replaced
This is where performance data becomes a creative input, not simply a media output.
Common campaign measurement mistakes
Tracking everything without defining what matters
A large dashboard can create the appearance of rigor while making decisions harder. Choose a small set of primary and diagnostic metrics tied directly to the campaign objective.
Treating channel benchmarks as universal standards
Industry benchmarks can provide context, but they rarely account for your audience, category, sales cycle, brand strength, offer, or creative quality. Your own segmented historical data is usually more useful.
Reporting tactical activity as business impact
Impressions and clicks can explain what happened, but they should not be presented as proof of revenue or brand growth without a defensible connection.
Waiting until the campaign ends
Measurement should be built into the operating rhythm. Early creative and funnel signals can help teams correct problems before waste compounds.
Optimizing away distinctiveness
Short-term response data can push teams toward familiar, formulaic work. Performance matters, but not every valuable brand effect appears immediately in a click metric. Balance short-term efficiency with long-term memory, meaning, and differentiation.
Ignoring qualitative evidence
Customer conversations, sales feedback, social comments, search behavior, and brand research can explain patterns that quantitative dashboards cannot.
How often should campaign performance be reviewed?
Reporting cadence should reflect the speed at which meaningful decisions can be made.
Daily or near-real-time monitoring
Best for high-volume paid campaigns, launch periods, pacing, delivery problems, tracking errors, and sudden performance changes.
Weekly performance reviews
Best for comparing audiences and creative variants, reviewing funnel movement, identifying fatigue, and deciding what to adjust next.
Monthly or campaign-level reviews
Best for connecting channel performance to pipeline, revenue, brand effects, and broader strategic learning.
A strong report should lead with the primary objective, explain the movement through a focused set of diagnostic signals, and end with a recommendation. “Performance was mixed” is not a useful conclusion. The report should make the next action clear.
How to build more useful benchmarks
The most meaningful benchmark is your own past performance under comparable conditions.
Build internal benchmarks by separating:
- Campaign objective
- Audience type
- Channel and placement
- Prospecting versus retargeting
- Creative format
- Offer type
- Geography
- Sales-cycle length
Use a rolling measurement window where appropriate so one unusually strong or weak campaign does not distort expectations. Compare medians as well as averages, and document major contextual factors such as seasonality, competitive promotions, budget changes, or tracking updates.
External benchmarks can still help, but use them as directional context rather than a verdict on campaign quality.
Key takeaways
- Organize metrics across business impact, operational health, and creative performance.
- Select KPIs based on the campaign objective before the work launches.
- Read metrics in combination to diagnose the real source of a problem.
- Use creative signals as an early warning system, not as proof of business impact by themselves.
- Build benchmarks from your own segmented historical data whenever possible.
- Make every report end with a clear decision or next action.
- Protect long-term brand distinctiveness while improving short-term performance.
Frequently asked questions
What are the most important campaign performance metrics?
The most important metrics are the ones tied to the campaign objective. Revenue, ROI, ROAS, CAC, and pipeline contribution help measure business impact. Conversion rate, CPL, and CPA show operational efficiency. CTR, engagement, completion rate, and brand lift help diagnose creative performance.
What is the difference between ROI and ROAS?
ROAS compares advertising revenue with advertising spend. ROI evaluates profit relative to the broader investment and can include production, technology, staffing, and other costs. ROAS is narrower. ROI provides a more complete view of financial return.
How many campaign metrics should a team track?
Track one or two primary KPIs tied to the objective, supported by a focused set of diagnostic metrics. The exact number depends on campaign complexity, but every metric should have a clear role in a decision.
Are impressions and engagement vanity metrics?
Not automatically. They become vanity metrics when they are presented without context or a connection to the campaign goal. For awareness campaigns, reach, frequency, engagement, and completion can be meaningful indicators when paired with brand research or downstream behavior.
When should creative be changed during a campaign?
Change creative when the evidence points to a message, attention, relevance, or fatigue problem. Avoid reacting to short-term noise. Look for sustained patterns across creative, audience, channel, and funnel data before deciding what to replace.
Turn campaign data into better creative decisions
The best measurement systems do more than prove what happened. They help teams understand why it happened and what to do next.
Ready to build campaigns that turn performance data into better creative decisions?
Spin Creative partners with enterprise marketing teams to develop brand-led creative that is built to perform, learn and evolve.